Showing posts with label diy kyoto. Show all posts

Wednesday, October 16, 2013

2 More Wattson arrive from the UK ... Again ??!!

Sorry, I got 2 Wattson from UK again ... It must be a kind of disease :-)

Actually there should have been another one coming at the beginning of september and it looks like it has been "lost" in transit - great, 70 EUR wasted ...- 

These ones were not that expensive, I got them in the last seconds of their auction each time ...

1st Wattson


Old screw version Transmitter, but with a 9V DC Input - no lid, where did it go ? -

This one must have been in a kitchen for years because it was kind sticky ... I had to clean it up myself with alcohol ... I would never ship something like this - incredible - 


Now it is clean and you can not tell the difference 
Pairing it with the Transmitter


2nd Wattson

Got it cheap too, but in much better condition: Bow, manuals, everything is CLEAN !


Old version of the Transmitter, Red antenna, screws, no DC 9V input


Everything has been re-boxed like new, that's more like I would do

After finding 2 UK to EU power adapters, we are ready to go

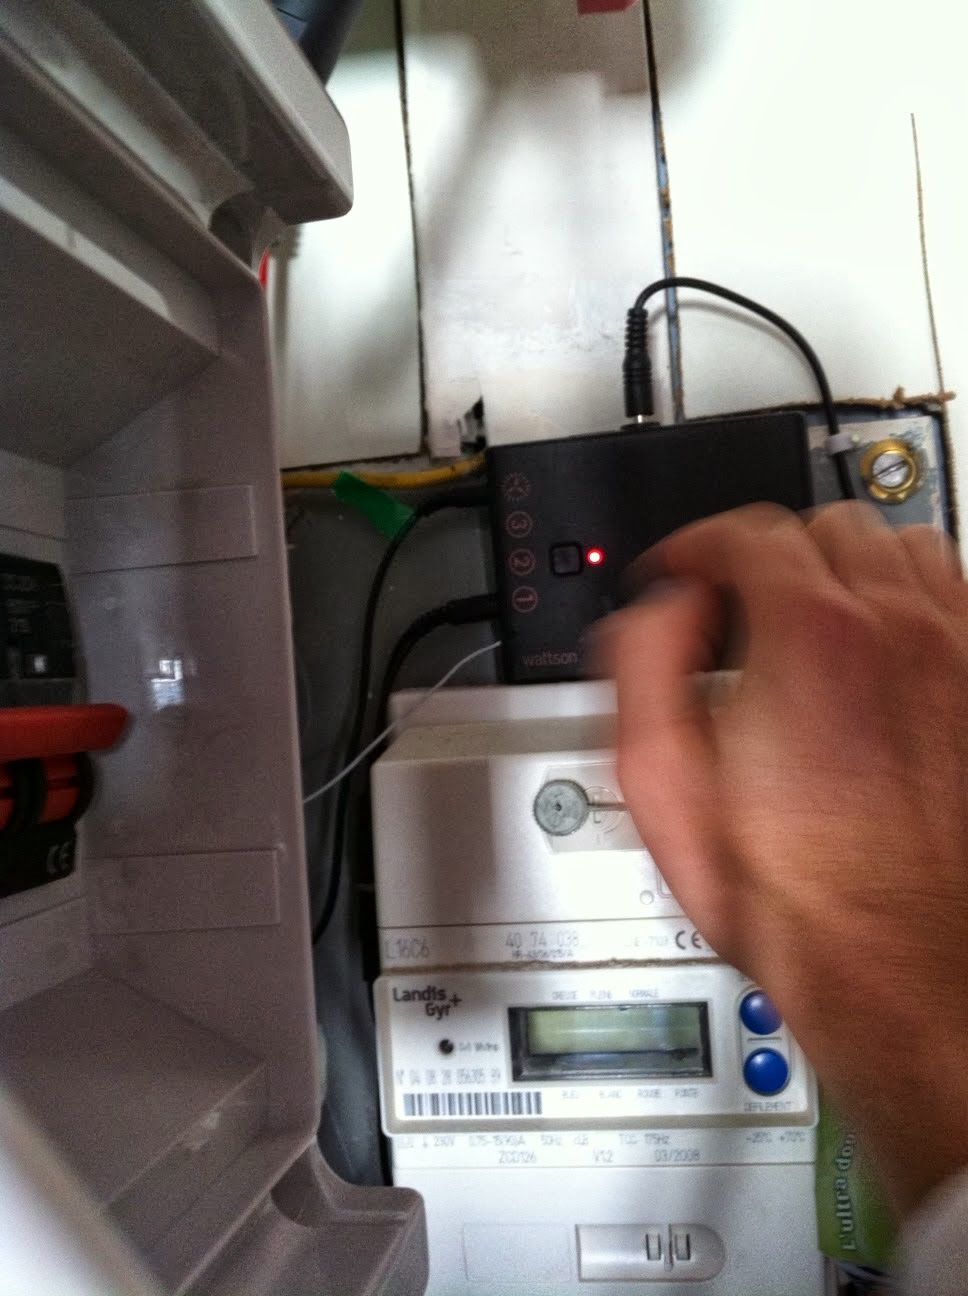
The 2 simple actions to pair a new - or used actually - Wattson unit: Depress the Transmitter button for few seconds until the red LED is solid, ...


... then you have 60s to go to the Wattson unit(s) and depress its pushbutton too, or insert a pin in the middle top hole and depress, until it says "PAIRING SUCCESSFULL"


Now that they are paired with the Transmitter, they display Usage or Used Power

This one in the back, the dirty one, had a really flat battery pack, it would not display anything until it was charged - strange ?? -


DIY Kyoto Ltd


There it is, displaying  the Usage

After plugging them in my Mac, and launching Holmes2, I enabled their Generated Power logging, so now they can display GENERATED POWER and NET POWER too;

Back view with the COLORS and NUMBERS mode: These are old units because they glow orange when the Net Usage is Negative, meaning Generation > Usage 


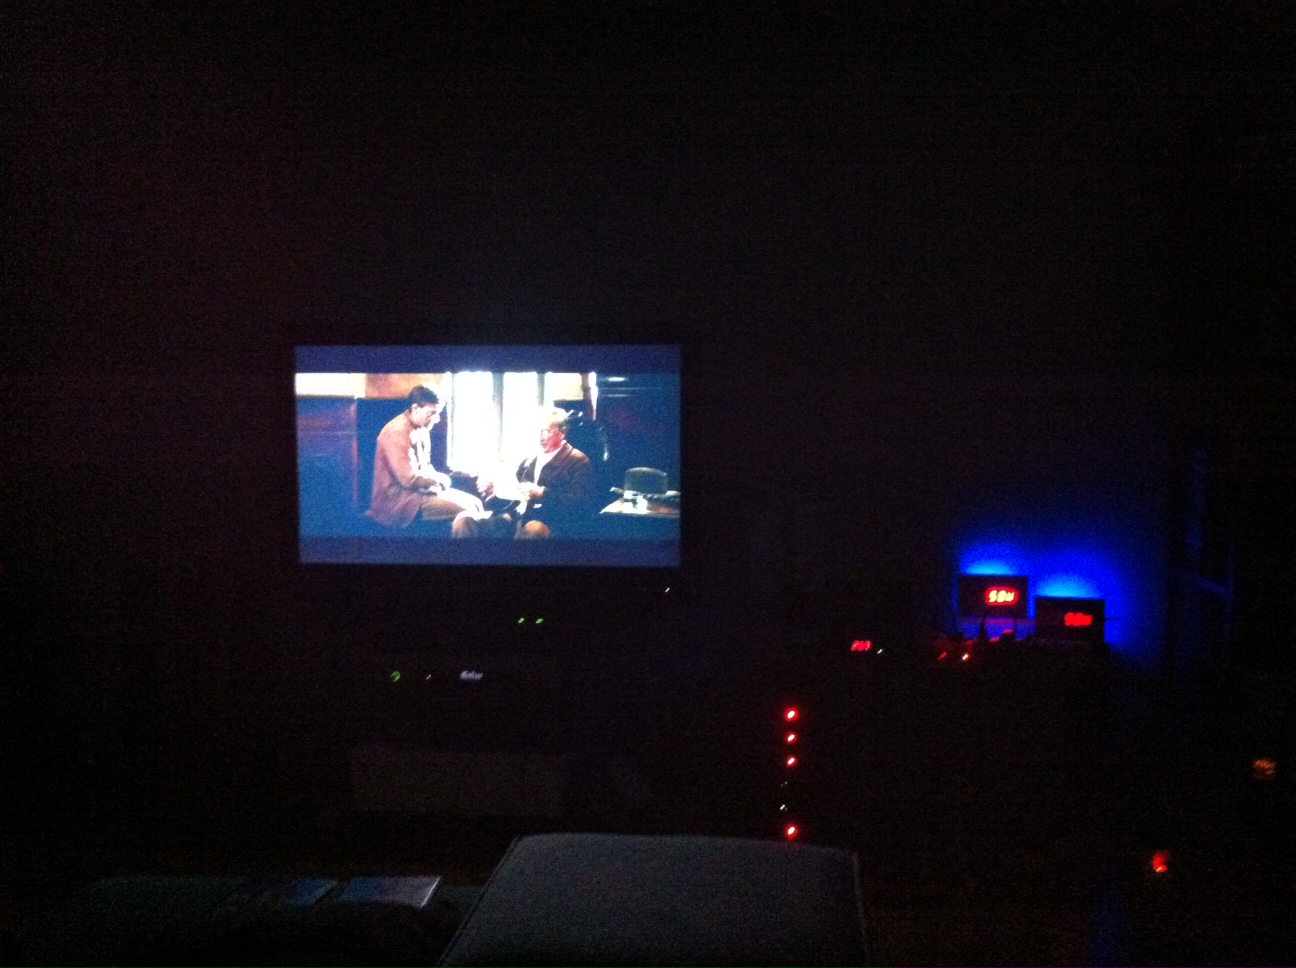
After, I brought down the Silver one and arranged them like this for few days: 
LEFT : Usage
RIGHT : Generation (= Solar + ESS)
TOP : Net Usage (Usage - Generation) 


Friday, January 18, 2013

It's All in the Monitoring !

Realising the potential of solar power in social housing…


Solar power provides an opportunity for social housing associations and landlords to improve the long-term energy prospects of tenants by alleviating fuel poverty and greatly reducing their carbon emissions.
And, despite cuts to feed-in tariffs (FiTs), some of which have already taken effect, the benefits of subsidies for landlords and discounted electricity bills for tenants offered by renewable energy will continue to transpire as inflation continues to rise and utility companies increase their prices. However, there are other measures that photovoltaic (PV) installation owners and their tenants can put in place to achieve the greatest benefits.


In the following, Mark Elliott, Director of energy monitoring specialist Energeno, explains how monitoring technology and smart meters hold the key to unleashing the full potential of PVs, and how Energeno’s range of equipment can help landlords and tenants alike combat fuel poverty.


As industry reports have stated, the full benefits of renewable energy can only be achieved if they are supported by efforts to encourage people to be energy efficient. Installations are often out of sight, out of mind, especially in social housing and commercial environments, so encouraging the behavioural change needed to achieve the true benefits of solar power has been difficult in the past.
Landlords and tenants alike need to gain true insight into energy use in their building, which will give them
control to reduce their own electricity bills – a key goal shared in social housing renewable energy strategies
and something we incorporate into our offering of energy monitoring technology.


The benefits of energy monitoring – introducing Wattson Solar Plus

Energy monitoring improves the financial and environmental performance of domestic and commercial buildings, and this has always been at the heart of what we do. An update to our Wattson Classic monitor – that shows electricity being generated in any building, whether it uses renewable energy or not – is the Wattson Solar Plus, which literally gives PV users the green light to use free electricity. Connected to an installation, it fits onto a shelf or even next to the TV and shows, in real time, how much electricity is being generated by an installation, how much energy is being used around the house and the carbon emissions being produced by energy use.

When an installation has generated surplus power, the monitor glows green, telling people when they can
use free electricity or sell it back to the grid. Giving tenants transparency in this way enables them to shift from using high energy consuming items, such as washing machines, when it is most costly to do so (i.e. when an installation is not generating at full capacity) to a time when it is free.


Not only does this aid with the ever present issue of fuel poverty facing many tenants by helping to reduce
their electricity consumption by up to 60%, but it can also increase the profitability of an installation for the
property owner.

Householder Sefton Owens champions low-carbon living and turned to the Wattson Solar Plus to measure the effects of solar PV. Owens explains: “Combining solar power with the Wattson Solar Plus has enabled me to get maximum efficiency out of my installation, and in the 12 months I’ve combined the two, I’ve managed to reduce my electricity consumption by over 60%. At any time I can see exactly how much energy is being produced and as soon as I’m in negative territory (i.e. generating more than I’m using) it is the time to switch on any electrical items I might need.

“If a few hundred watts are being generated, I’ll make sure that any electrical device that needs charging,
i.e. laptops, phones, batteries etc., are all charged for free. When it’s generating up to 3-4kWh, it’s on with
the washing machine, dishwasher, vacuum cleaner and generally larger energy consuming items.

“The Wattson has also engaged the rest of the family in energy saving. It allows us to control the energy we
use and its visual impact positively encourages people to look at it. I firmly believe that this type of product
will have a significant impact on not only reducing the CO2 we all produce in our households, but, as I’ve proved, can save some serious money. ”

The Solar Plus system also uses multiple transmitters so that one monitoring system can tie together energy consumption generated in different buildings to where the PV system is installed – something that appealed to Professor Ian McLean and his family. Professor McLean explains: “A key reason for investing in a PV system was to benefit from the FiT and make use of the free electricity we were going to generate.
However, when the PV originally went in, the inverter was installed in a different building, so it was impossible to see what was happening and the energy being generated from the house.

“Wattson Solar Plus provided the ideal solution because it gives us all the information we need on a single
monitor. And it copes with the fact that our PV is on a separate building to the one where we use the energy.”

This solution can also be used in schools, libraries and other buildings fitted with solar PV and using their
own energy.


Providing a detailed analysis of energy use

While our monitors provide immediacy for users, i.e. they can make a decision to turn off the lights or turn
on the washing machine, depending on their energy consumption at that moment in time, Wattson Anywhere is our online portal that provides a breakdown of energy use in a building and how much free electricity has escaped. This shows users where and when they have consumed and saved the most electricity, which can
help them make decisions and plan their energy use over a period of time. It can be accessed remotely via
the internet and also encompasses an online community, so tenants can share their experiences and ideas on
energy saving with each other.

We know that using energy monitoring technology is a real game changer and our products provide visibility of energy use and generation, consistently reminding people of the potential their rooftop holds. After all,
seeing is believing for most people.


Building on behavioural change with Energeno’s smart meters

We have demonstrated how our products can change people’s attitudes towards energy use; however, we wanted to bring something else to the market that would assist users in their mission to become completely energy efficient and reduce their outgoings.


Using ‘free electricity’ becomes easy with monitoring technology, and many of our users have become experts. However, this is only the case if you are at home at the same time as the energy is generated. Our
latest innovation is Optiplug, a smart socket that listens to the Wattson system and learns how much power
appliances use around a building.It then automatically diverts enough energy to power an appliance, when free energy is available.

In addition to this, we also supply Optimmersion, which converts surplus free electricity into hot water. This
device works in a similar way to Optiplug, switching surplus energy to immersion heaters. It is installed
between the immersion tank and the consumer unit and supplies variable power for hot water, depending on
the excess energy being generated.
Typical savings for Optimmersion users are around £55 per year for a gas boiler and £80 for electrically
heated water.

The use of surplus energy to heat hot water brings another dimension to energy efficiency and we are confident this type of product will fast become a mainstream add on to any installation.

We’re seeing more and more renewable installations fitted as standard on new housing. However,
we know that the biggest driver for installations is the financial benefits.
When landlords invest in solar PV, they are freeing tenants from utility companies, enabling them to secure their own energy use, and in some cases, lifting them out of fuel poverty.

But when they combine this with the right monitoring technology and smart metering, the results can be far
greater than they had hoped.

To find out more about Energeno’s range of products, please visit our website.


Source: Energeno
Direct PDF format article

Wednesday, October 24, 2012

Wattson & Wattson Silver

Last Friday, after unboxing and synchronising the Wattson Silver, I took it downstairs to compare its display with the original Wattson:
Well, they display exactly the same figures, exept that the Wattson Silver would not display Net Usage (Usage - Generation), so I had to plug it into my netbook and set it up in Holmes, Wattson's software
After that, it was displaying negative values too, but the backlighting was not green, but yellow, which corresponds to an older version of Wattson - They changed this yellow color to green later on


Same figures, that is normal, they get the readings from the same transmitter


Green & Yellow for generation; Here they are displaying different figures, because they did not get the signal at the same time I guess

Both Blue, for low usage


Friday, September 7, 2012

Energy monitoring turns Leicestershire village onto savings

An innovative energy efficiency scheme in the small Leicestershire village of North Kilworth has had a dramatic effect on local resident’s consumption patterns and behaviour according to a recent survey.

Stuart Dainton at Village Power showcasing Wattson energy monitors

A total of 80 homes across the quaint village were fitted with Energeno’s Wattson energy monitors as part of a scheme lead by the Village Power Community Interest Company (CIC). The rollout of the energy monitoring devices was designed to help the village cut its collective carbon footprint whilst simultaneously raising awareness of energy usage at a local level.

The scheme impressed those at the Local Energy Assessment Fund (LEAF) who committed to fund the rollout and installation of the monitors across the village.

After two months of using their new monitors, two thirds of residents noticed that their energy usage had changed for the better and the same number of residents were eager to find out more information about the energy efficiency. Nine out of 10 residents also indicated that they would recommend an energy monitor to a friend.

Stuart Dainton of Village Power CIC explained the decision to outfit the whole village with energy monitoring devices, saying: “As a village that is trying to be as energy efficient as possible, we are always looking at ways to inspire people to make changes in their lives. Providing energy monitors has been a great way of doing this.

“We chose Wattson monitors due to their visual impact. Energy use is shown with colours and a bright display and they really are a conversation piece! Wattsons can change behaviour and have a real impact on reducing energy use.”

Mark Elliott, Director of Operations at Energeno added: “We’re delighted to be supporting this fantastic initiative and that the idea of energy monitoring has been so well-received. The Wattson monitor is playing a vital role in helping residents’ to gain a much clearer picture of what steps they can take to help reduce their household energy bills and make a measurable contribution to reducing the carbon footprint of the village as a whole.”


Source : Solar Power Portal


Tuesday, September 4, 2012

Mark Elliott demonstrates the Wattson home energy system

Mark Eliott from Energeno demonstrates the Wattson energy meter


A video demonstration of the Wattson, an award-winning energy management system and, for our money, the top gizmo at Ecobuild


The Wattson is one of the hottest eco gizmos on the market, has won awards for innovation and starred in television shows across the world. In this colourful video demonstration, Mark Eliott shows The Eco Experts the Wattson's features.

Mark Elliott: “One of the great things about Wattson is that you can see how much money you are spending, how much carbon you are using, and also the Watts value.

“Also, the colours at the back go between blue to red, depending on your average usage. So the Wattson learns how much you use in a day and tells you when you’re using more than you normally do.

“And one of the magic features is that when you’re generating more electricity than you’re using, it beautifully glows green. Okay, so you know just to switch on those things that you need to… just change your habits… those things you can… just use it [the electricity you’re producing] while it’s free.”


Source: Extract from the Eco Experts

Thursday, August 30, 2012

Wattson WiFi & Wattson Professional trial

Great ! I asked Mark Eliott from Energeno (formerly Diy Kyoto) if I could test their new version of Wattson (the Energy Monitor).
He replied that they were working on a WiFi version of it and few weeks after I received a package from the UK :-)


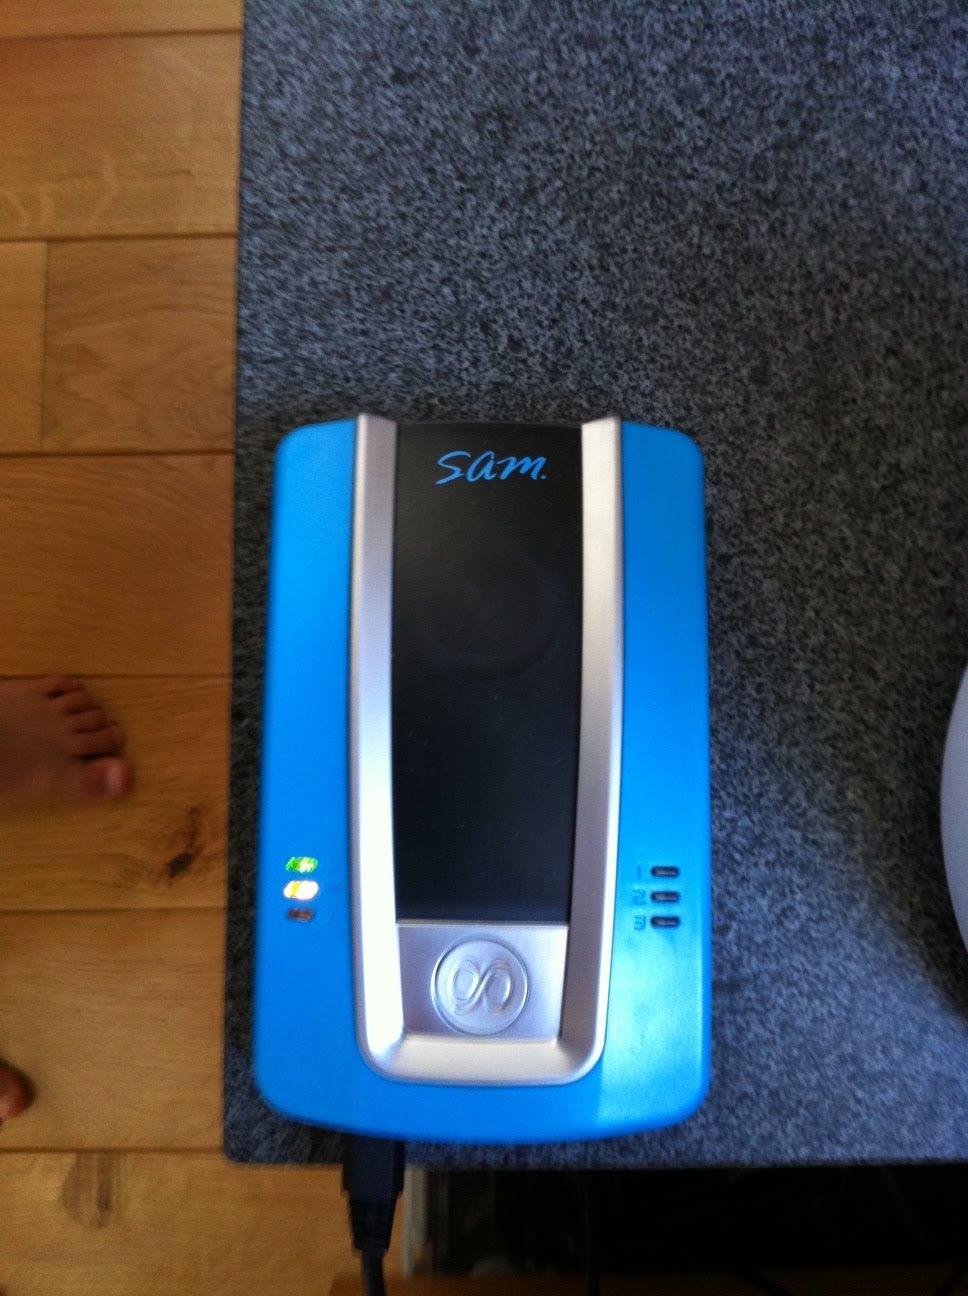
In fact the first step is to test this little device (Australian device called ISU, from SAM) that gathers the RF transmissions from the original Wattson transmittor and sends them directly to a data center for live online access of the readings.
A red LED is flashing on the right side of this device every time the transmittor sends a reading and at the same time as Wattson updates its display
Later on this functionality will be integrated into Wattson PCB directly I guess


They opened a account for me on their Wattson Professional website, and my readings data is displayed there in live graphs  :-)
I can see my usage, generation (from  my ESS for now, later on from my Solar System too), and the net reading (= usage - generation)


Here are more detailed views of the Wattson Professional web interface showing my first two days of trial:

The page view of the portal is an overview of 5 independant views:
- Daily usage & generation
- Daily Revenue/bill
- Weather forecast
- Used Energy Breakdown
- Generated Energy Breakdown

NB :More pages/views also exist and I will talk about them later on ...

Here is my overview of my first full day: August 28th

If I zoom on the 1st graph, I get a much more detailed view:
In red is the Usage, mostly covered by the green, the Grid Generation, most of the time in my case
When I turn on my ESS, then we see a blue line showing the Solar(or Wind, etc) Generation; at that time the Grid Generation is lowered by the same amount and the green line dicreases : I buy less power from the utility company (EDF)

Now in the lower part of the portal, we have the:

- Used Energy Breakdown: it is showing the part of enegry imported from the Grid and the part that was generated in house by the solar or wind system (in my case it is from my LiFePO4 ESS for now, my solar system coming in few weeks)


- and the Generated Energy Breakdown: this one shows how much energy from Generation (Solar, Wind, etc) went into feeding your own usage (Used in House) or back into the utility grid (Exported)


Here, same thing for next day, August 29th:


Let's analyse this day in details (I was not home):
- The big usage at night is the water heater (2,000W) finishing its lower rate (22:24 to 06:24) heating at night
- After that the only thing showing is the fridge coming on and off in cycles (waves)
- Around 9 we see the breakfasst activity: toaster, Nespresso coffee machine, lights
- Around noon, lunch activity: stove, micro-wave oven
- After that, the two spikes must be the washing machine (laundry)
- Then around 15, back to fridge only cycles
- Until I came back home around 19:30 and started my ESS: we start to see some Generation (blue line) until 22:10
- After that, at 22:24 the water heater come back on automatically, and the additionnal spikes are the dishwasher running at night too (it is quiet)


Thanks to Mark and all the team @ Energeno !


Please Share this Post if you Liked it !

Please Share this Post if you Liked it ! Thanks !
Related Posts Plugin for WordPress, Blogger...