Showing posts with label data. Show all posts

Saturday, April 26, 2014

Apple is ready for its closeup on clean energy

Apple is ready for its closeup on clean energy — Tech News and Analysis
Apple is ready for its closeup on clean energy

Apple has started telling its clean power story big time this week, with new reports, photos, and a video narrated by Tim Cook. Here's why it's opening up now:

Apple is celebrating Earth Day this week by shining a spotlight on its clean energy and carbon footprint reduction initiatives. While Apple has been working on having 100 percent of its data centers run on renewable energy sources for a couple years, the company on Monday is showing off an environmentally-themed video narrated by CEO Tim Cook, accompanied by some awesome solar photos on Apple.com, and a long feature in Wired on its clean power projects.

Why now (beyond the somewhat contrived Earth Day event)? When I published this investigative piece last November on Apple's solar projects, it was difficult to get information from Apple on the projects. Now about six months later, Apple is ready to talk.

Apple's solar farm in North Carolina

One of the reasons for Apple's new willingness to talk is that many of Apple's clean power projects are now far beyond the experimental phase. Its flagship solar farms in North Carolina are up and running and providing energy to the grid, and, as Wired reported, Apple has already started installing a small solar array made by SunPower at its newest solar farm in Reno, Nevada. Apple has learned a lot over the years about how to procure clean energy, and work with utilities, and is ready to tell that story (it definitely wasn't an easy road).


The company's new environmental chief Lisa Jackson has also been on the job about a year now, which has given her some time to make decisions and figure out Apple's environmental initiatives. She's fixed some things along the way, like the fact that Apple was underreporting the impact of aluminum mining and processing on its carbon footprint, according to Wired.

Apple solar


The next step for Jackson after helping Apple's data centers run on clean energy is to focus on the clean power footprint of Apple's retail stores. Apple now has 120 stores powered only by renewable energy courses, and it has another 135 to go in the U.S., as well another few hundred overseas.

It's important that Apple is finally willing to highlight its clean power projects and tell this story of transforming energy infrastructure. Other internet companies that haven't invested in similar moves — like Twitter and Amazon, according to the latest report from Greenpeace — will be watching and taking notes on how to respond.

The next-generation of consumers will care more about the carbon footprint and sustainability of their brands than the last, and implementing these moves now will help internet brands gain customers and remain relevant.


Source: GigaOM

Thursday, August 30, 2012

Wattson WiFi & Wattson Professional trial

Great ! I asked Mark Eliott from Energeno (formerly Diy Kyoto) if I could test their new version of Wattson (the Energy Monitor).
He replied that they were working on a WiFi version of it and few weeks after I received a package from the UK :-)


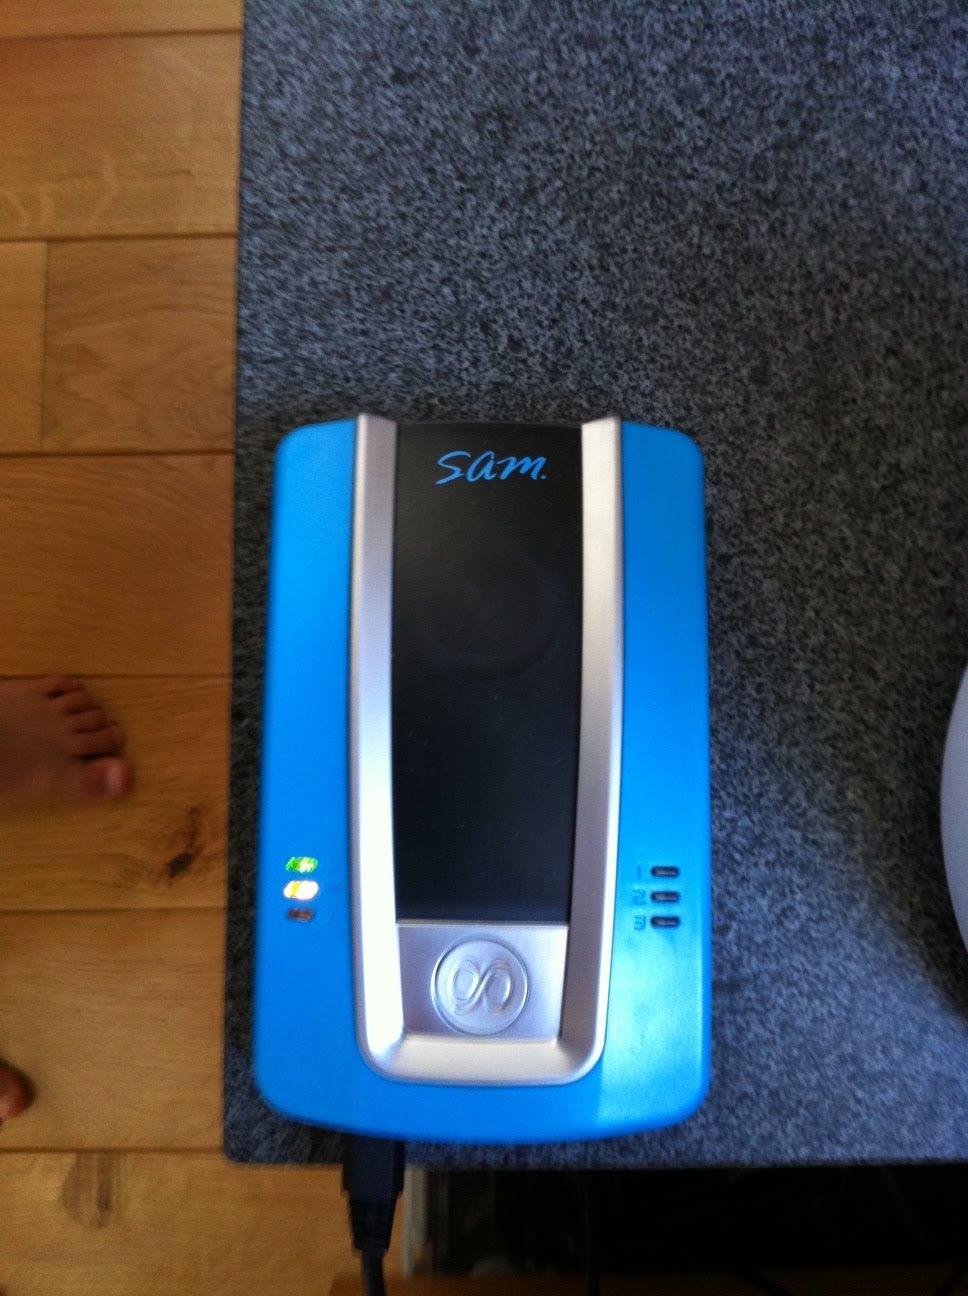
In fact the first step is to test this little device (Australian device called ISU, from SAM) that gathers the RF transmissions from the original Wattson transmittor and sends them directly to a data center for live online access of the readings.
A red LED is flashing on the right side of this device every time the transmittor sends a reading and at the same time as Wattson updates its display
Later on this functionality will be integrated into Wattson PCB directly I guess


They opened a account for me on their Wattson Professional website, and my readings data is displayed there in live graphs  :-)
I can see my usage, generation (from  my ESS for now, later on from my Solar System too), and the net reading (= usage - generation)


Here are more detailed views of the Wattson Professional web interface showing my first two days of trial:

The page view of the portal is an overview of 5 independant views:
- Daily usage & generation
- Daily Revenue/bill
- Weather forecast
- Used Energy Breakdown
- Generated Energy Breakdown

NB :More pages/views also exist and I will talk about them later on ...

Here is my overview of my first full day: August 28th

If I zoom on the 1st graph, I get a much more detailed view:
In red is the Usage, mostly covered by the green, the Grid Generation, most of the time in my case
When I turn on my ESS, then we see a blue line showing the Solar(or Wind, etc) Generation; at that time the Grid Generation is lowered by the same amount and the green line dicreases : I buy less power from the utility company (EDF)

Now in the lower part of the portal, we have the:

- Used Energy Breakdown: it is showing the part of enegry imported from the Grid and the part that was generated in house by the solar or wind system (in my case it is from my LiFePO4 ESS for now, my solar system coming in few weeks)


- and the Generated Energy Breakdown: this one shows how much energy from Generation (Solar, Wind, etc) went into feeding your own usage (Used in House) or back into the utility grid (Exported)


Here, same thing for next day, August 29th:


Let's analyse this day in details (I was not home):
- The big usage at night is the water heater (2,000W) finishing its lower rate (22:24 to 06:24) heating at night
- After that the only thing showing is the fridge coming on and off in cycles (waves)
- Around 9 we see the breakfasst activity: toaster, Nespresso coffee machine, lights
- Around noon, lunch activity: stove, micro-wave oven
- After that, the two spikes must be the washing machine (laundry)
- Then around 15, back to fridge only cycles
- Until I came back home around 19:30 and started my ESS: we start to see some Generation (blue line) until 22:10
- After that, at 22:24 the water heater come back on automatically, and the additionnal spikes are the dishwasher running at night too (it is quiet)


Thanks to Mark and all the team @ Energeno !


Friday, March 9, 2012

Follow home consumption from work

I can always know throught out the day how much electricity is used at home by looking at my Wattson meter remotly (on the web or on iPhone, using a webcam robot called Karotz); Here is what it looks like :

photo.jpg

I will come back to this Wattson Energy Meter in details later, showing you where to buy, how to install and use it on a daily basis ...

Few hours later this afternoon, I recieve another picture of meter from home :

photo.jpg


Thursday, March 8, 2012

Wattson Energy Meter Review

I will talk to you more about this great Energy Meter called WATTSON For now, here is a review of a Solar specific version of it I own a regular version of it, it works great, display is large and very simple, and it logs a month of data (both consumption & production) To be continued ...

Please Share this Post if you Liked it !

Please Share this Post if you Liked it ! Thanks !
Related Posts Plugin for WordPress, Blogger...