Showing posts with label wattson professional. Show all posts

Friday, January 25, 2013

Wattson Energy Monitor is getting a lot better !

Wattson is already a great energy monitor because it shows real time power usage & generation, and this is what people need to see to understand what is going on in their home


Day or Night, you know your usage & generation


But if you wanted to see your energy history, then you had to plug Wattson into your computer, upload the data and launch the Holmes graph software to see your usage & generation figures over the last days, months or years ... Good but a bit tedious and time consuming


Energeno will probably launch soon Wattson Anywhere, a portal where you can see all this online; Their director Mark Elliott mentionned this in his last article and Energeno has a link to one of their team member's Wattson Anywhere Public graph on their Optimmersion product page; Check out the very interesting PDF documentation of this Wattson Family Product here: Optimmersion PDF Documentation


I think that now I can say that I have been beta testing this Wattson Wifi & Wattson Anywhere plateform for the last three months and I love it; You can find my home usage and - BESPSS - micro generation graphs on my public Wattson Anywhere page

This portal is great because it works on an iPhone, iPad, Mac, PC and more ... You do not need to install any app on your device, just a web browser is needed


iPad screenshot


iPhone screenshot


You can click to zoom in and see the details of the selected period


Via a user / password link I can access the History, Analysis on the Energy Generated, Account / Set up; Here are some more screenshots (Chrome on OS X) of the History tab:

History - Power


History - Energy

Friday, September 28, 2012

LiFePO4 ESS Update - Daytime Charging OK for a week now

Starting last saturday, I now have been charging and discharging my LiFePO4 ESS for almost a full week


Saturday = Charging all day


Sunday = Discharging all day (with some pauses)


On Monday, I set up a timer to start and stop the charger automatically and leave it all day long while at work 

Starting on a timer at 07:30, the batteries are slowly charging (@ 10A) at home, during the day, until the charge is cut off at 17:40 to simulate the daytime charging it will do with the solar system in the future

Using Karotz as a webcam, I can watch my meters from work while or on my iPhone from anywhere


Arriving home, here is the situation: we are at the very end of the charge, the charger is pushing 1A only into the batteries and voltage showing 29V, the cut off is very near


Lowest capacity cells groups shwoing 3.93V and 3.91V are fine, and probably did not reach 4V

Total energy used to charge on monday = 3.3 kWh

Charger is pushing 1A only into the batteries and voltage showing 29V, the cut off is very near

and charger end of charge cut off has now happened: Ampmeter is reading 0A and voltage is slowly dropping from 29V

Charger LED2 is now green, meaning the charge is over (and it will not start again unless the AC side is cut off for 10 seconds, it is a security feature)

Wattson Pro graph for Monday: Charging 07:30-18:40 & Discharging 18:40-22:30 
The blue line represents the production from the BESPSS and is almost perfectly matching the usage (in red), unless too high (production maximum output is 1000W for now)


Tuesday: Charging 07:30-17:40 & Discharging 17:40-22:30


After that I moved Karotz to see the Ampmeter too


Reaching the end of the charge: Ampmeter showing 5A (half and going down) and voltage 28.6V


Timer cut off => Ampmeter is showing 0A and voltage is dropping


Wednesday: Charging 07:30-17:40 & Discharging 17:40-22:30


photo.jpg

photo.jpg

Thursday: Charging 07:30-17:40 & Discharging 17:40-auto cut off at 22:45


Overall I am very satisfied with this week of tests:

 - Charger work fine (long periods of charge and automatic cut off at the end of charge) and the batteries are now well balanced (no group of cells is going too high)

- Automated power output from the BESPSS is matching the home usage (as much as possible) and automatic cut off is working fine, protecting the battery bank from going to low in voltage


Thursday, August 30, 2012

Wattson WiFi & Wattson Professional trial

Great ! I asked Mark Eliott from Energeno (formerly Diy Kyoto) if I could test their new version of Wattson (the Energy Monitor).
He replied that they were working on a WiFi version of it and few weeks after I received a package from the UK :-)


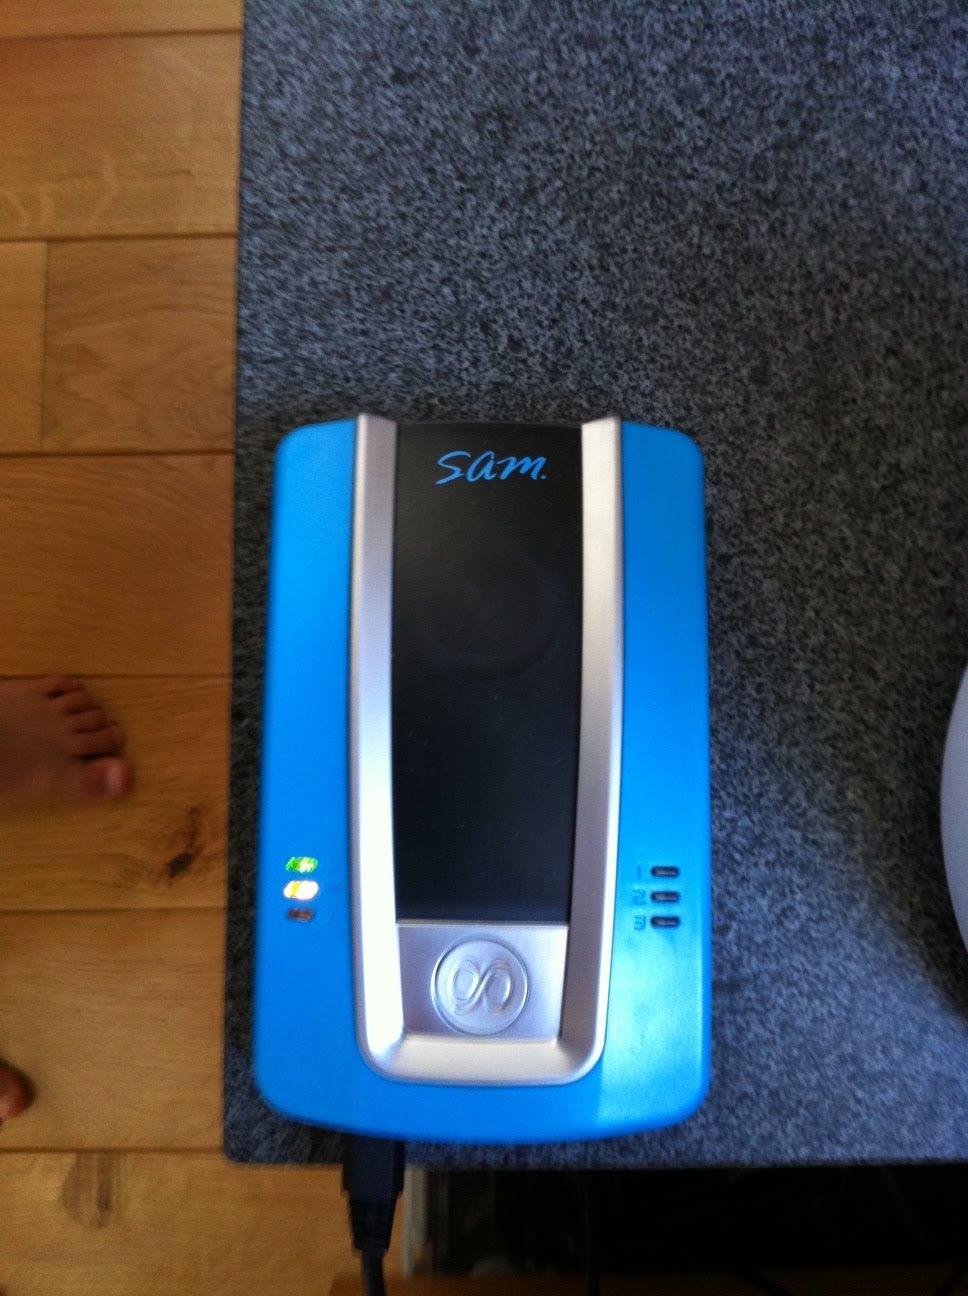
In fact the first step is to test this little device (Australian device called ISU, from SAM) that gathers the RF transmissions from the original Wattson transmittor and sends them directly to a data center for live online access of the readings.
A red LED is flashing on the right side of this device every time the transmittor sends a reading and at the same time as Wattson updates its display
Later on this functionality will be integrated into Wattson PCB directly I guess


They opened a account for me on their Wattson Professional website, and my readings data is displayed there in live graphs  :-)
I can see my usage, generation (from  my ESS for now, later on from my Solar System too), and the net reading (= usage - generation)


Here are more detailed views of the Wattson Professional web interface showing my first two days of trial:

The page view of the portal is an overview of 5 independant views:
- Daily usage & generation
- Daily Revenue/bill
- Weather forecast
- Used Energy Breakdown
- Generated Energy Breakdown

NB :More pages/views also exist and I will talk about them later on ...

Here is my overview of my first full day: August 28th

If I zoom on the 1st graph, I get a much more detailed view:
In red is the Usage, mostly covered by the green, the Grid Generation, most of the time in my case
When I turn on my ESS, then we see a blue line showing the Solar(or Wind, etc) Generation; at that time the Grid Generation is lowered by the same amount and the green line dicreases : I buy less power from the utility company (EDF)

Now in the lower part of the portal, we have the:

- Used Energy Breakdown: it is showing the part of enegry imported from the Grid and the part that was generated in house by the solar or wind system (in my case it is from my LiFePO4 ESS for now, my solar system coming in few weeks)


- and the Generated Energy Breakdown: this one shows how much energy from Generation (Solar, Wind, etc) went into feeding your own usage (Used in House) or back into the utility grid (Exported)


Here, same thing for next day, August 29th:


Let's analyse this day in details (I was not home):
- The big usage at night is the water heater (2,000W) finishing its lower rate (22:24 to 06:24) heating at night
- After that the only thing showing is the fridge coming on and off in cycles (waves)
- Around 9 we see the breakfasst activity: toaster, Nespresso coffee machine, lights
- Around noon, lunch activity: stove, micro-wave oven
- After that, the two spikes must be the washing machine (laundry)
- Then around 15, back to fridge only cycles
- Until I came back home around 19:30 and started my ESS: we start to see some Generation (blue line) until 22:10
- After that, at 22:24 the water heater come back on automatically, and the additionnal spikes are the dishwasher running at night too (it is quiet)


Thanks to Mark and all the team @ Energeno !


Please Share this Post if you Liked it !

Please Share this Post if you Liked it ! Thanks !
Related Posts Plugin for WordPress, Blogger...