Showing posts with label monitoring. Show all posts

Monday, June 15, 2015

EVTV Friday Show - March 13, 2015

- JLD505 BMS Details
- David Seabury's legacy instrument cluster CAN driver
- Measuring temperature digitally
- Damien Maguire's inside the DMOC645 inverter

Sunday, October 27, 2013

Meet Tesla’s HQ Supercharging Dashboard, Most Model S “Fills” Between 30 kWh and 40 kWh


Here is something we didn’t expect to see at Tesla’s HQ – a Supercharging dashboard that pretty much tells us everything we always wanted to know about the network…in real time!


The dashboard displays all the current and coming soon location in the US for Tesla Supercharging, as well as lots of other interesting tidbits. And something you can’t find hosted online.

Here are some highlights as of when this picture was shot last week:
Total Energy Delivered: 1,382,822 kWh
Miles Charged: 3,950,921
Gallons of Gas Offset: 158,307
Numer of Charges In Last 7 Days: 1,576

The dashboard also shows the growth rate in the usage of the supercharger system as well as the usage per station. In total, 32 active Supercharging locations are being ranked in real time on the dashboard (Tesla website currently lists only 30).


Overall the best performing stations can be found in Fremont (as one would assume it would be located by the Tesla factory), with Hawthorne nipping at its toes. Worst performing station? Glenwood Springs, CO.


As of interest: The most popular amount of charging done at a station also appears to be between 30kWh and 40 kWh, with 20kWh-30kWh coming in second and 40 kWh- 50 kWh third.


Source: Inside EVs

Thursday, May 30, 2013

LiFePO4 ESS - Last night testing with 2 Wattson Monitors


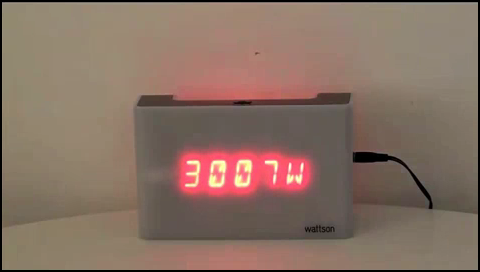
Last night I was testing my LiFePO4 ESS as usual, after a full day of charge, and this time I brought the 2nd Wattson downstairs in my bedroom to display Usage, Generation, or Net Power


Instead of turning the ESS off when the low rate TOU comes in at 22:26 (10:26 PM), I decided to leave it on and see how it bahaves, poushing all it can for a full hour

At the end of this hour, the new 35mm2 longer cables were just luke warm, nothing was over-heating at all

Power graph (iPhone)


Power graph (iPad)

Energy graph

Energy Analysis

Thursday, April 11, 2013

Introduction to Wattson Solar Plus

Wattson Solar Plus energy monitor explained; The colors make it very easy to understand for everyone :-)


"This short video goes through the different modes on Wattson Solar Plus while Richard talks us through what we are looking at."


More on Energeno's website


Wednesday, March 27, 2013

Is Nissan looking into Bottom Balancing ?


Looking at the real-time visitors monitor on my blog, I just saw this interesting visit from a Japanese from Yokohama who arrived loooking for "how to bottom balance a battery pack" on the Bing search engine


Nissan's headquaters being in the same city, I thought: Maybe Nissan's engineers are looking into a new strategy for their BMS for the LEAF, e-NV200 or ESFLOW ... Who knows ?

Anyways, this person ended up reading about my bottom balancing tool and probably the whole Bottom Balancong simple strategy behind it

Friday, March 8, 2013

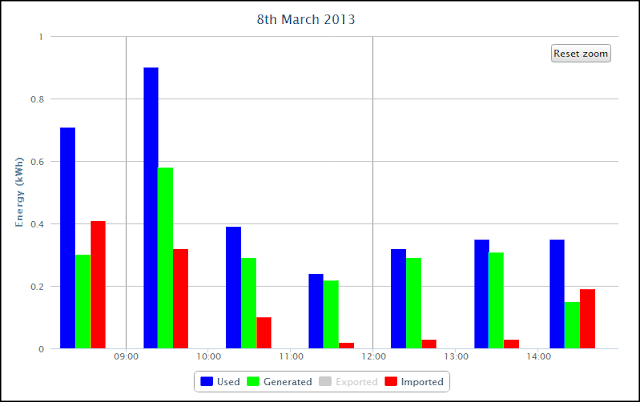
LiFePO4 DIY ESS - Today Micro Generation Sticks to the Usage

It is interesting to see how close the generation from my DIY ESS is to our home usage today


Look how the generated Energy bars (Green) are close to the usage bars (Blue) and how small are the Imported bars (Red) 


Friday, January 25, 2013

Wattson Energy Monitor is getting a lot better !

Wattson is already a great energy monitor because it shows real time power usage & generation, and this is what people need to see to understand what is going on in their home


Day or Night, you know your usage & generation


But if you wanted to see your energy history, then you had to plug Wattson into your computer, upload the data and launch the Holmes graph software to see your usage & generation figures over the last days, months or years ... Good but a bit tedious and time consuming


Energeno will probably launch soon Wattson Anywhere, a portal where you can see all this online; Their director Mark Elliott mentionned this in his last article and Energeno has a link to one of their team member's Wattson Anywhere Public graph on their Optimmersion product page; Check out the very interesting PDF documentation of this Wattson Family Product here: Optimmersion PDF Documentation


I think that now I can say that I have been beta testing this Wattson Wifi & Wattson Anywhere plateform for the last three months and I love it; You can find my home usage and - BESPSS - micro generation graphs on my public Wattson Anywhere page

This portal is great because it works on an iPhone, iPad, Mac, PC and more ... You do not need to install any app on your device, just a web browser is needed


iPad screenshot


iPhone screenshot


You can click to zoom in and see the details of the selected period


Via a user / password link I can access the History, Analysis on the Energy Generated, Account / Set up; Here are some more screenshots (Chrome on OS X) of the History tab:

History - Power


History - Energy

Friday, September 21, 2012

How can electric cars be charged with electricity from wind power and give power back to the grid ?

Smart grids

How can electric cars be charged with electricity from wind power and give power back to the grid? It's all about "smart grids", i.e. smart grid that can handle large fluctuations in the grid that comes with renewable energy such as wind turbines. In the case of charging the electric vehicles, it is interesting to see how electricity is transmitted from the network to the vehicle, and there are different strategies and work is under way to define standards in the field. In Test Site Sweden we are working with the automotive and power industries to test and validate the charging interfaces.

Interactive Smart Grid Technology Demonstrators

The continued work with Smart Charging systems at ANL led to the development of interactive displays that demonstrated the benefits of smart charging and smart grid as well as the vehicle to grid interfaces present in such systems. Two generations of the interactive smart grid display was developed, the first one is shown below and was demonstrated at the Technology Transfer Meeting May 11th in Gothenburg and at the Electric Vehicle Symposium short after.

Generation 1 of the interactive Smart Grid Display (Argonne National Laboratory)

The second generation of the display was developed by ANL for the Bright Green Expo.


Generation 2 of the interactive Smart Grid Display (Argonne National Laboratory)


Demonstration of a Smart Charge application for mobile phones

The demonstration was developed by TSS and Consat Engineering AB to show how managing charging could be performed using a mobile phone. The demonstration is available as a flash – movie and shows how the driver can reserve a park and charge spot and also manage the charge process. A screen shot from the demonstration is shown.


Smart Grid Technology explained

As our attention turns to new cars that run partially or completely on electricity, how can we redesign our electric grid to not only handle the new load, but make electricity cheap and efficient for everyone? Argonne engineer Ted Bohn explains a model of a "smart grid" that gives consumers the power to choose their own prices and sources of electricity.


Charging Stations


In order to test and validate the charging of EVs we have developed the ChargeAlyzor which is a combination of a charging station and a oscilloscope. By this you can very accurately measure and monitor the voltage and current feed into the vehicle.


The ChargeAlyzor (Test Site Sweden)


Source: TestSiteSweden

Thursday, September 20, 2012

LiFePO4 ESS Update - No more computer needed

After several weeks of testing, I finally unplugged the computer from the Arduino board and my LiFePO4 ESS is now running in standalone


The laptop computer is gone ...


Grid Tie Inverters stack and Generated Power (in Watts)


Karotz is watching Wattson :-)
I can see our home Net consumption it anytime through its webcam when I am not home or upstairs 


LiFePO4 Battery pack voltage and Wattson Energy Monitor showing Net consumption  


Cell level voltage watching & Arduino board unplugged (except for power from the micro USB connector)


And the Wattson Professional graph shows that it is working well, following the usage and trying to minimize it using battery stored energy whenever necessary (last long test was from 19:00 to 22:00)

Please Share this Post if you Liked it !

Please Share this Post if you Liked it ! Thanks !
Related Posts Plugin for WordPress, Blogger...