Winter: Charging during the night - off peak rate TOU -, and using the Stored Energy from the ESS and Solar during the day to shave peaks and compensate home usage as much as possible


Waking up around 6AM, I waited patiently for the
SMA Grid Tie Inverter to start producing from Solar this morning, and it did at exactly 7AM, with 150W
The forecast for today looks very good: Sunny all the way !

6 AM : 0W produced, 141W used

8 AM : It went up slowly but steadily to 200W roughly around 8AM

and the progression goes on ... and my
ESS is working fine as you can see :-)
Follow the Graph provided by Wattson Anywhere portal here
 ESS
ESS already doing its job : charging its
battery pack with
Solar Juice
Solar
Generation on the left,
Net Usage on the right

Net Usage = 12W - during breakfast -

Going up steadily during the morning

Still close to 0W thanks to the ESS absorbing the surplus of Solar Energy

Oops, there is alittle gap in production; Did the inverter stop and restarted or maybe a data logging issue (?), anyways it did not last long

Back to normal

Here, my wife must be cooking because the house
Usage went up, but the
ESS went to Grid Tie Mode and pushed close to 2000W to help, it is all working as expected :-)
Shortly after, the Usage goes down and the
ESS goes back to Charger Mode, bringing the Net Usage close to 0W

Around 2 PM, the maximum number of Chargers are ON in the ESS and we still have some 100W of surplus, wasted ...
From 1PM to 5PM, after a plateau, we have a steady slope from 850W to 500W of Solar Production

Coming back home around 7:30 PM, the air conditioning had been on for 20mn, and the ESS was pushing several hundreds of Watts to help; I opened the metal cabinet to see what was going on inside and the battery pack voltage
You can see the ESS helping - a lot - the solar production to compensate the Air Conditioning consumption at the bottom right on the graph: more or less 600W during diner

Like yesterday, 5 or 10mn after 9 PM, the Sunny Boy quits and all the power from now on is coming from the ESS - mostly - : TV, DVD player, fan, etc ... and later on the Water Heater - which will empty the ESS battery pack eventually -

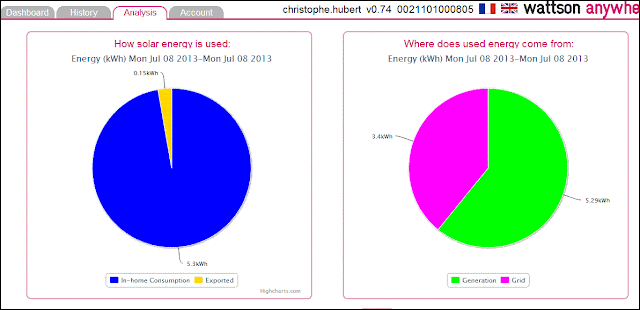
The next day I could visualize the Energy Analysis tab on Wattson Anywhere online portal and you can see that 2/3rd of the Energy used comes from Solar - Direct or Stored - and that almost all the Solar Energy has been self consumed in-house :-)